14 Canine Cancer Detection
We have a survey open right now that we invite you to fill out.
Two videos about research carried out to train dogs to detect cancer are included here. The first describes the statistics of diagnostic testing and the second develops the science including health details, procedures, as well as the selection, training, and care of appropriate dogs.
Diagnostic testing is described in a general context with an explanation of sensitivity, specificity, and positive and negative predictive values. Focus then turns to ongoing research investigating the ability of dogs to detect prostate and bowel cancer.
Currently in the proof of concept phase, this research is initially training the dogs on laboratory grown cells with validation experiments to be undertaken. If successful the focus will turn to using patient samples to estimate diagnostic accuracy and investigate how this would be used in clinical practice to improve patient outcomes.
This research is being carried out in collaboration between the Departments of Biostatistics (Assoc. Professor Robin Turner) and Pathology (Dr Katrin Campbell) at the University of Otago, K9 Medical Detection (Professor Sarah Young, Pauline Blomfield), and the Dunedin Hospital (Dr Sharon Pattison).
Data
There is 1 file associated with this presentation. It contains the data you will need to complete the lesson tasks.
Videos
Video 1: The Statistics of Diagnostic Testing
Details of diagnostic testing are outlined to illustrate the concepts of Sensitivity, Specificity, False Negatives, and False Positives leading to Proof of Concept of a procedure to diagnose, in this case, prostate cancer. Laboratory-developed urine samples are used in this investigation. Validation of the procedure to detect Prostate Cancer was held over five consecutive days detecting 200 samples of various concentration ratios from 100% down to 5%. The dog successfully identified those with Prostate Cancer (Sensitivity) 100% of the time and successfully ignored those without the disease (Specificity) 100% of the time. The research therefore can move to the next phase in the pursuit of a non-invasive diagnostic procedure for diagnosing prostate cancer.
Video 2: Dogs and Science Working Together
In the proof of concept phase, the dogs were trained on laboratory grown cells. With the success of a simple, non-invasive diagnostic test using these urine samples confirmed, stage 2 of the research places the focus on actual patient urine samples in a clinical trial to estimate diagnostic accuracy and investigate how this would be used in clinical practice to improve patient outcomes.
Objectives
Tasks
0. Read Data
0a. Read in the data
First check you have installed the package readxl (see Section 2.6) and set the working directory (see Section 2.1), using instructions in Getting started with R.
Load the data into R.
The code has been hidden initially, so you can try to load the data yourself first before checking the solutions.
Code
#loads readxl package
library(readxl)

#loads the data file and names it canine
canine<-read_xls("CanineSampleData.xls")

#view beginning of data frame
head(canine)
Code
#loads readxl package
library(readxl)
Warning: package 'readxl' was built under R version 4.2.2Code
#loads the data file and names it canine
canine<-read_xls("CanineSampleData.xls")

#view beginning of data frame
head(canine)
# A tibble: 6 × 3
Dog Cancer Positive
<dbl> <dbl> <dbl>
1 1 1 1
2 2 1 0
3 3 0 1
4 4 1 1
5 5 0 0
6 6 1 1This loads a set of sample data points, similar but not identical to the sample data used in the video. The actual data from the Canine Cancer study is not available, so we have constructed this fake data to allow you to practice the calculations and get a feel for how this kind of analysis would be carried out.
1. Cross-Tabulation, Bar Plot (2 variables)
1a. Cross-Tabulation
Summarise the data using a 2-way table.
In the code below, rows will correspond to test result (Positive) and columns will correspond to cancer status (Cancer).
Code
#construct a table with labels (dnn=) and row and column totals (addmargins)
addmargins(table(canine$Positive,canine$Cancer,dnn=c("Positive","Cancer")))
In the code below, rows will correspond to test result (Positive) and columns will correspond to cancer status (Cancer).
Code
#construct a table with labels (dnn=) and row and column totals (addmargins)
addmargins(table(canine$Positive,canine$Cancer,dnn=c("Positive","Cancer")))
Cancer
Positive 0 1 Sum
0 9 2 11
1 4 10 14
Sum 13 12 251b. Bar Plot
While the table in Task 1a. provides a good summary of the data, a picture can also be helpful.
Construct a bar plot of test result according to cancer status. This plot gives us an idea of the kind of sensitivity, specificity, positive predictive and negative predictive values we should end up with.
Code
#assign table to an object to supply heights to bars
dogMatrix<-table(canine$Positive,canine$Cancer)
Code
#bar plot
barplot(dogMatrix,beside=TRUE,names.arg=c("No Cancer","Cancer"),col=rep(c("wheat3","tan4"),2),
  ylab="Count",xlab="Cancer Status",main="Test Result by Cancer Status")

#legend
legend("top",c("Negative","Positive"),fill=c("wheat3","tan4"))
Code
#assign table to an object to supply heights to bars
dogMatrix<-table(canine$Positive,canine$Cancer)
Code
#bar plot
barplot(dogMatrix,beside=TRUE,names.arg=c("No Cancer","Cancer"),col=rep(c("wheat3","tan4"),2),
  ylab="Count",xlab="Cancer Status",main="Test Result by Cancer Status")

#legend
legend("top",c("Negative","Positive"),fill=c("wheat3","tan4"))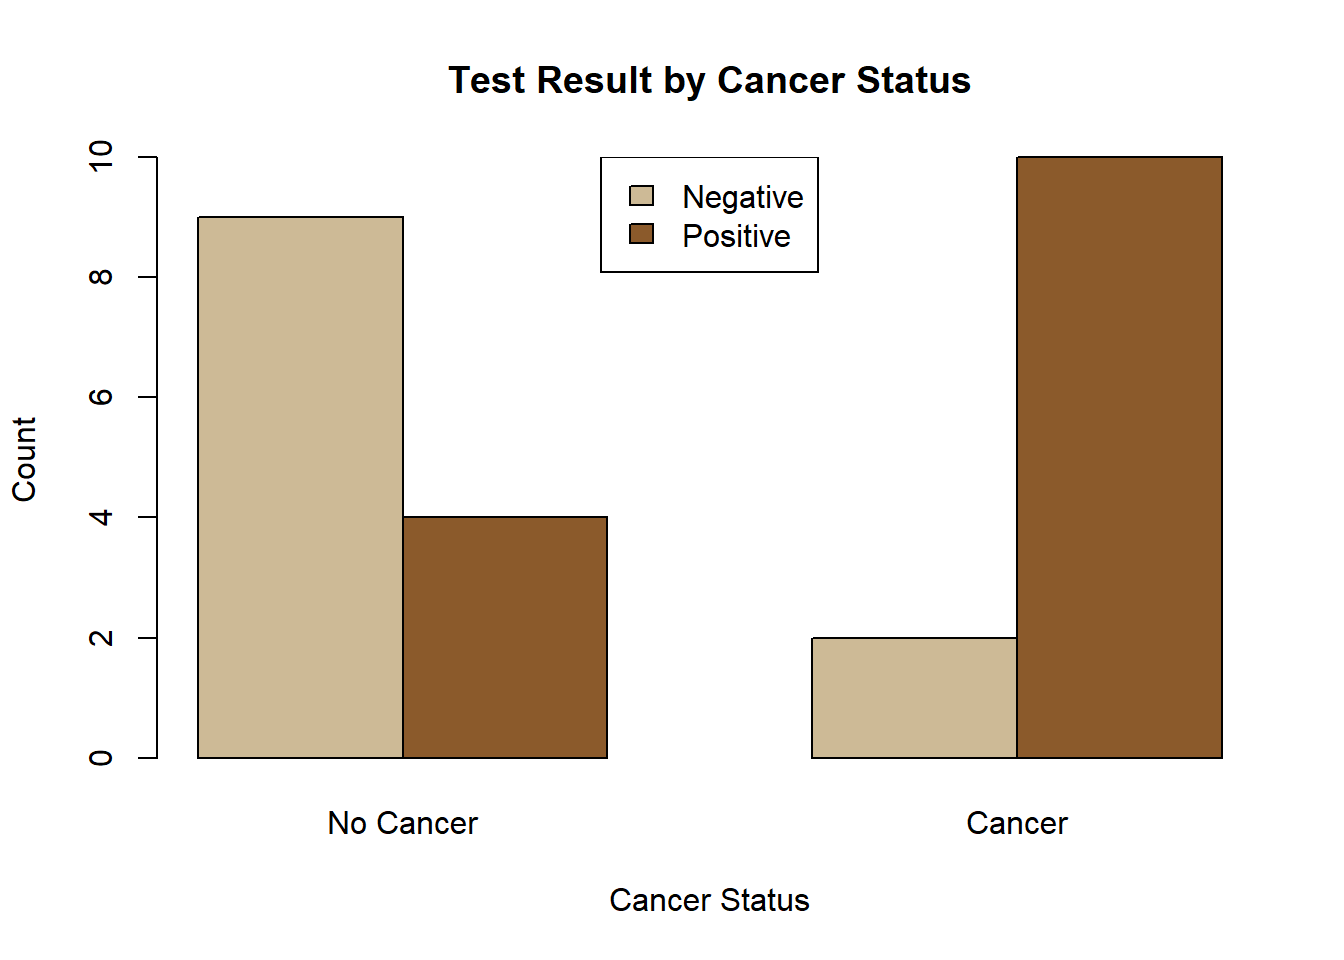
The vast majority of samples with cancer received a positive alert from the dogs. The majority of samples with no cancer did not receive positive alerts, although the difference is less marked than for cancer samples.
2. Diagnostic Classification
Think about the situation that each entry in the Task 1a. table represents.
What is a true negative and how many of these occurred in your data?
What is a true positive and how many of these occurred?
What is a false negative and how many of these occurred?
What is a false positive and how many of these occurred?
A true negative is receiving a negative result when the cancer is not present, 9 occurred in our data.
A true positive is receiving a positive result when the cancer is present, 10 occurred in our data.
A false negative is receiving a negative result when the cancer is present, 2 occurred in our data.
A false positive is receiving a positive result when the cancer is not present, 4 occurred in our data.
3. Sensitivity, Specificity, Predictive Values
3a. Sensitivity
Calculate the sensitivity of the canine sniff test for cancer detection, using the sample data in Task 1.
Interpret this value. Who would be most interested in this?
Sensitivity = TP/(TP+FN)*100
Code
10/12*100Code
10/12*100[1] 83.3333383.33% of people with cancer receive a positive sniff test. Sensitivity is most important for test development and accuracy assessments.
3b. Specificity
Calculate the specificity of the canine sniff test for cancer detection, using the sample data in Task 1.
Interpret this value. Who would be most interested in this?
Specificity = TN/(TN+FP)*100
Code
9/13*100Code
9/13*100[1] 69.2307769.23% of people without cancer receive a negative sniff test. Specificity is most important for test development and accuracy assessments.
3c. Positive Predictive Value
Calculate the positive predictive value of the canine sniff test for cancer detection, using the sample data in Task 1.
Interpret this value. Who would be most interested in this?
Positive predictive = TP/(TP+FP)*100
Code
10/14*100Code
10/14*100[1] 71.4285771.43% of people with a positive sniff test have cancer. The positive predictive value is most important for individual risk assessment.
3d. Negative Predictive Value
Calculate the negative predictive value of the canine sniff test for cancer detection, using the sample data in Task 1.
Interpret this value. Who would be most interested in this?
Negative predictive = TN/(TN+FN)*100
Code
9/11*100Code
9/11*100[1] 81.8181881.82% of people with a negative sniff test do not have cancer. The negative predictive value is most important for individual risk assessment.
4. Sensitivity vs. Specificity Trade-Off
In the context of the canine cancer study, think about some reasons we would favour the test having high sensitivity vs. high specificity
A high sensitivity test picks up almost all cancer cases. This is beneficial as cancer is a life-threatening disease and early detection is important.
A high specificity test hardly ever incorrectly returns a positive result. This avoids subjecting people to unnecessary further tests and causing unnecessary worry.
5. Study Design
Suppose the resources are acquired to implement a large scale dog training and testing programme. What are some additional variables it may be worthwhile to collect data on?
Examples include dog breed, length of training required, cancer type, method of scent delivery. Many possible answers as long as justification is provided.